
This Week's Pulse — Globeville Single-Family Homes
Globeville closings stretched to 97 days and prices slipped 9% YoY. It's not oversupply — it's a gap between seller expectations and buyer demand.
The bottom line
Globeville's single-family market is in a strategy-driven recalibration.
View report sections
The quick read
Globeville closings stretched to 97 days and prices slipped 9% YoY. It's not oversupply — it's a gap between seller expectations and buyer demand.
What this means if you're buying
- Negotiate from data. With YTD odds at 41%, sellers who priced ambitiously are open to credits, rate buy-downs, and inspection items.
- Watch for stagnant listings. Two of the 10 active homes are already past average DOM — those are the cleanest negotiating opportunities.
- Use seasonality. March 2025 produced six closings from buyers shopping in January and February — winter is less slow than people think.
What this means if you're selling
- Reset to 2025, not 2024. Anchoring to last year's $419K average is the single biggest reason listings sit.
- Prep matters more in a misaligned market. Cosmetic refreshes, sharp photos, and a tight feature story separate movers from sitters.
- Time the listing window. Top closing months were March, September, and August — list four to eight weeks ahead to ride the wave.
The Numbers Behind the Read
Supporting data for the signals above.
Average Sale Price (2025)
$384.7K
vs $419.8K in 2024
Average Days to Close (2025)
97
+11 days YoY
12-Month Avg Sale Price
$393.6K
Odds of Selling (12 mo)
46%
Odds of Selling (YTD)
41%
Active Listings
10
Under Contract (Flowing)
1
90-Day Projection
9 / 7
New listings vs sales
Buyer / Seller Tilt
Buyer leaning
Index
38
At a glance: Buyers have a slight edge — well-prepared offers can win without overpaying.
Median Sold Price · 6 mo
Source: local MLS data as of June 25, 2025. Deemed reliable but not guaranteed. Educational use only — not an appraisal or valuation of any specific property.
Deeper ReadRead more
Globeville's single-family market is in a strategy-driven recalibration. 2025 closings averaged 97 days at $384,727 — an 11-day slowdown and a 9% price dip from 2024's 86 days at $419,836. Trailing-12-month odds of selling sit at 46%, dipping to 41% YTD.
Inventory isn't elevated (10 active homes vs twice that in 2024), so the slowdown is a misalignment story, not a supply story. The 90-day projection of 9 new listings against 7 sales tilts the pond slightly toward buyers.
Sellers anchored to 2024 numbers are sitting; sellers who price and prep against current data are still closing.
Neighborhood context
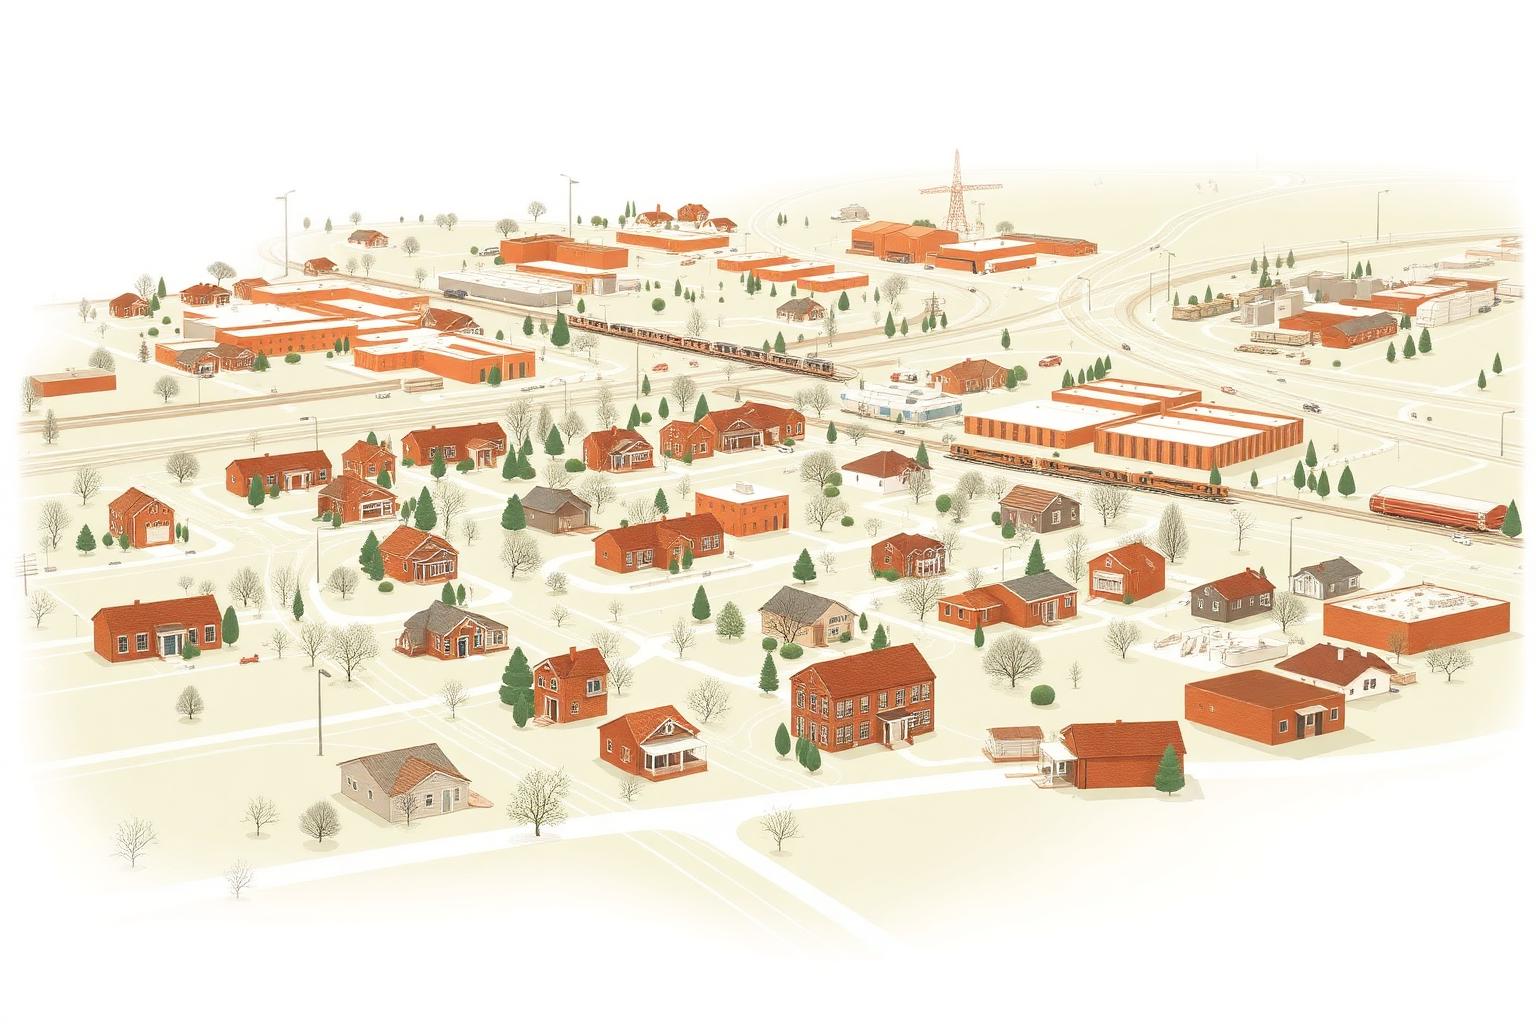
Globeville sits in north Denver at the crossroads of I-25, I-70, and the South Platte, with rail yards and adaptive-reuse industrial flanking modest brick bungalows and small-lot single-family stock. Inventory has stayed lean even as the rest of metro Denver fluctuates, but cautious, value-driven buyers are dictating pace. The neighborhood's RiNo-adjacency and long-term redevelopment momentum keep it on investor radar even as short-term pricing recalibrates.
Frequently asked
Why has Globeville slowed down?
It's not oversupply — only 10 homes are active, half what 2024 carried. The slowdown is a gap between seller pricing expectations and what cautious 2025 buyers are willing to pay.
Is this a buyer's or seller's market?
Buyer-leaning. With 41% YTD odds of selling and a 90-day forecast of 9 new listings against 7 sales, buyers have the advantage — especially on listings that have lingered.
When should I list?
Aim for the closing peaks — March, August, September. List four to eight weeks ahead so your listing hits when buyers are actively touring.
Is the 9% YoY price drop a crash signal?
No — it's a recalibration after a strong 2024. Fundamentals (RiNo adjacency, lean inventory, redevelopment pipeline) remain intact. The penalty is for overpricing, not for owning here.
Explore planning toolsOpen
Tools & Resources
Run the numbers, then keep reading.
Four calculators sized to Globeville's typical price band. Pick the question you're working through. All educational.
Payment snapshot
30-year fixed · Principal & interest
$6,472/mo
Loan amount
$1,024,000
Down cash
$256,000
Rate used
6.50%
Estimate excludes taxes, insurance, HOA, and closing costs. For planning only, not a loan offer.
Quick references
Glossary
Real estate terms, plain-English.
Sold-to-list, days on market, months of inventory — what they mean and why they move.
ReadBuyer checklist
Before your first tour.
What to have lined up — pre-approval, inspection priorities, the price band that matters.
ReadSeller checklist
Before you list.
Prep that consistently improves early activity — without overspending on renovations.
ReadNew construction
How builders structure incentives.
Rate buy-downs, design-center upgrades, and metro district disclosures to read first.
ReadCalculators are for planning only. Figures are estimates and not a loan, rental, valuation, or closing statement. Always confirm with a licensed lender or financial professional.
Tools & Resources
Run the numbers, then keep reading.
Four calculators sized to Globeville's typical price band. Pick the question you're working through. All educational.
Payment snapshot
30-year fixed · Principal & interest
$6,472/mo
Loan amount
$1,024,000
Down cash
$256,000
Rate used
6.50%
Estimate excludes taxes, insurance, HOA, and closing costs. For planning only, not a loan offer.
Quick references
Glossary
Real estate terms, plain-English.
Sold-to-list, days on market, months of inventory — what they mean and why they move.
ReadBuyer checklist
Before your first tour.
What to have lined up — pre-approval, inspection priorities, the price band that matters.
ReadSeller checklist
Before you list.
Prep that consistently improves early activity — without overspending on renovations.
ReadNew construction
How builders structure incentives.
Rate buy-downs, design-center upgrades, and metro district disclosures to read first.
ReadCalculators are for planning only. Figures are estimates and not a loan, rental, valuation, or closing statement. Always confirm with a licensed lender or financial professional.

About the author
Written by Jackson Granger.
Broker Associate · REALTOR® Coldwell Banker Realty · License FA.100105702. Jackson writes The Granger Report each week from his work across Denver Metro and the Front Range.
The Granger Report is provided for educational and informational purposes only and is not legal, financial, or tax advice. Market data is deemed reliable but not guaranteed and should be verified before making real estate decisions. Market conditions can change.
Keep reading