
Denver Metro
Are Denver Home Prices Up or Down? Compared With When?
Introducing a new way to explore Denver home appreciation, starting with a year that matters to you.
Jackson Granger · · 4 min read

Are Denver home prices going up or down?
It’s a reasonable question. Before answering it, though, there’s another question worth asking:
Compared with when?
Compared with last quarter? Last year? The year you bought your home?
Those are different questions, and they can produce very different answers. A market can be below a recent high and still be above where it stood several years earlier. Neither comparison tells the whole story on its own.
That’s why I’ve created a new resource for The Granger Report: Denver Metro Home Appreciation. The interactive page brings together the metro’s price history from 1991 through the second quarter of 2026, with a chart, year-by-year changes, and the underlying data available to explore.
My goal is to give you a place to step back, ask questions, and put the numbers into perspective.
The full-history view
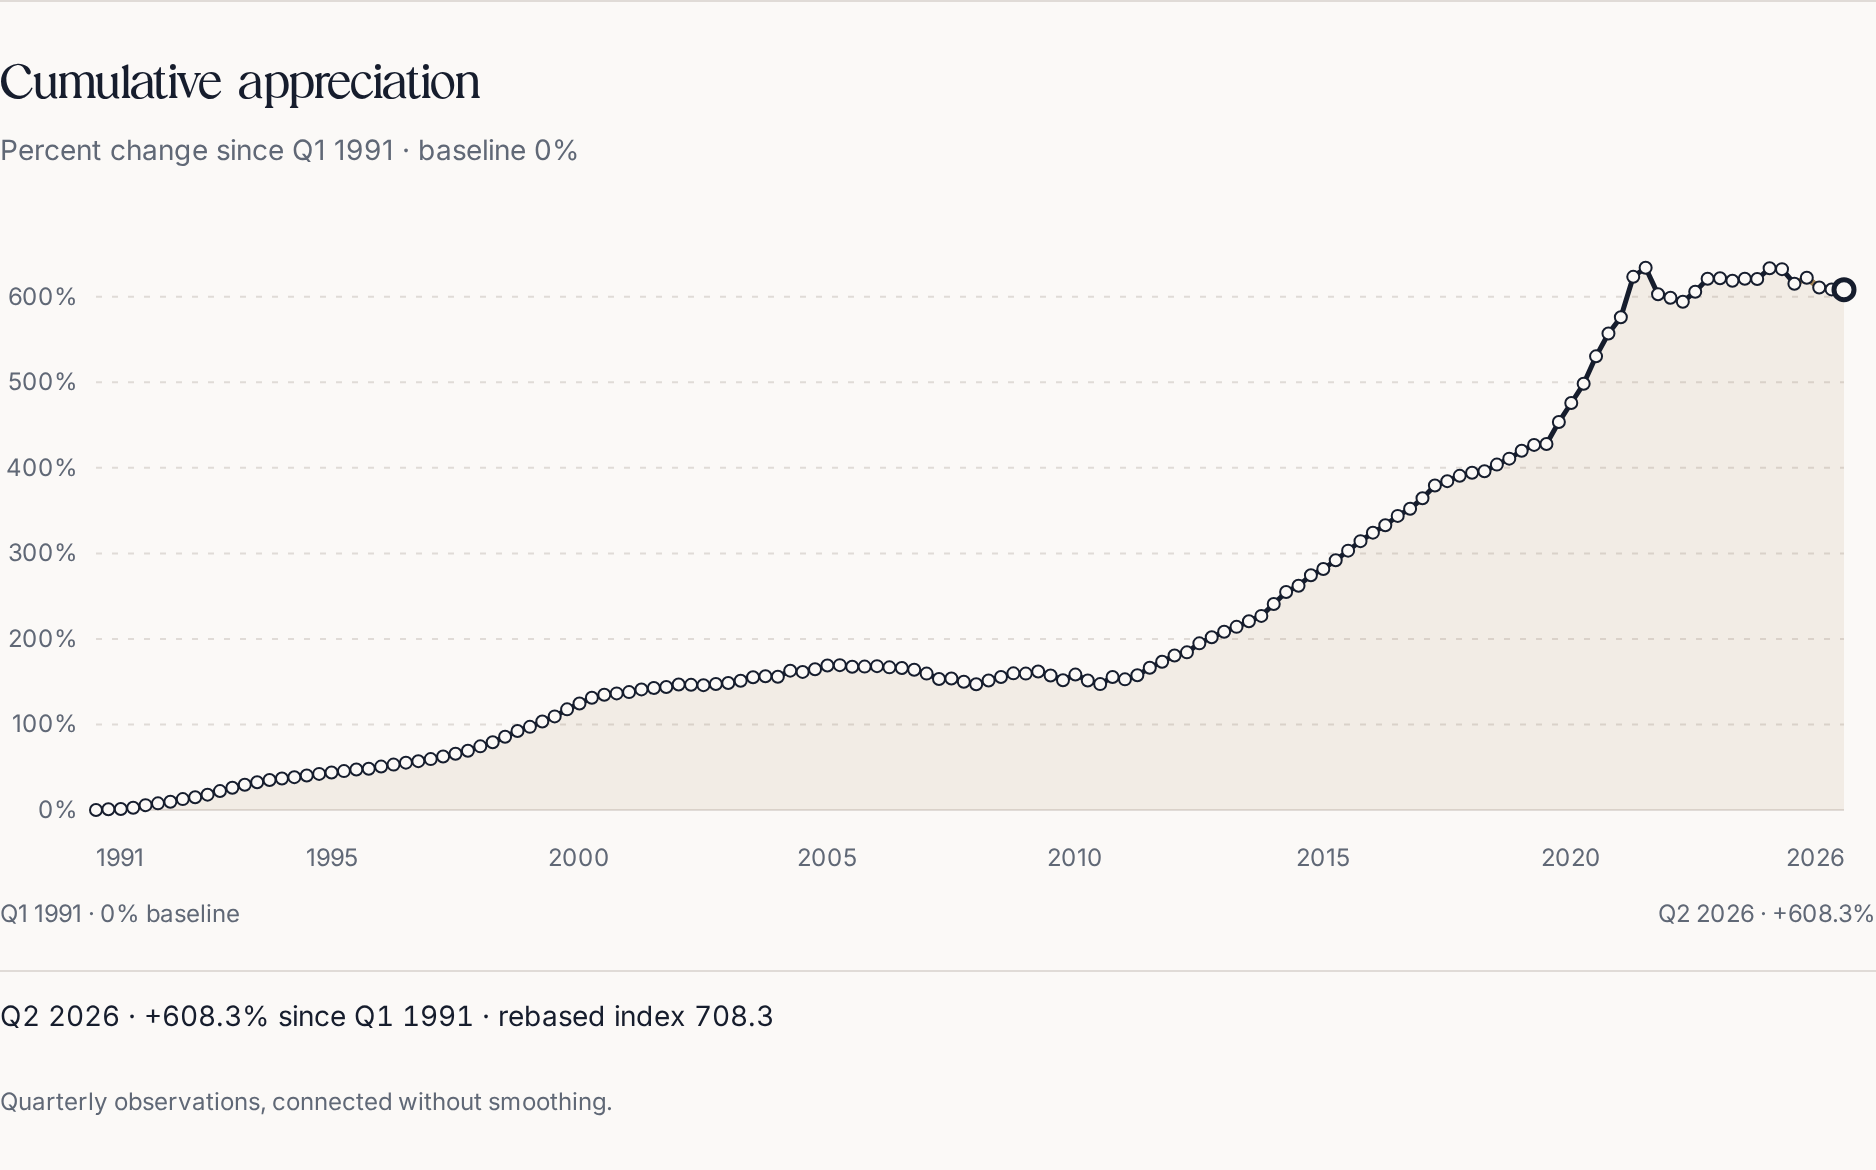
The seasonally adjusted FHFA purchase-only metro series starts at Q1 1991 with a zero-percent cumulative baseline and ends at Q2 2026. The screenshot includes both axes, quarter endpoints, the latest-quarter reading and the note that quarterly observations are connected without smoothing. The collapsed table contains every real quarterly observation and the same cumulative calculation. Historical context, not a forecast or appraisal; FHFA may revise observations.
Underlying figures
| Quarter | Seasonally adjusted index | Rebased index (Q1 1991 = 100) | Cumulative change since Q1 1991 |
|---|---|---|---|
| Q1 1991 | 100.00 | 100.0 | 0.0% |
| Q2 1991 | 100.81 | 100.8 | +0.8% |
| Q3 1991 | 101.24 | 101.2 | +1.2% |
| Q4 1991 | 102.67 | 102.7 | +2.7% |
| Q1 1992 | 105.66 | 105.7 | +5.7% |
| Q2 1992 | 107.77 | 107.8 | +7.8% |
| Q3 1992 | 109.62 | 109.6 | +9.6% |
| Q4 1992 | 112.72 | 112.7 | +12.7% |
| Q1 1993 | 114.91 | 114.9 | +14.9% |
| Q2 1993 | 117.93 | 117.9 | +17.9% |
| Q3 1993 | 122.12 | 122.1 | +22.1% |
| Q4 1993 | 126.06 | 126.1 | +26.1% |
| Q1 1994 | 129.52 | 129.5 | +29.5% |
| Q2 1994 | 132.46 | 132.5 | +32.5% |
| Q3 1994 | 135.09 | 135.1 | +35.1% |
| Q4 1994 | 136.81 | 136.8 | +36.8% |
| Q1 1995 | 138.38 | 138.4 | +38.4% |
| Q2 1995 | 140.30 | 140.3 | +40.3% |
| Q3 1995 | 142.23 | 142.2 | +42.2% |
| Q4 1995 | 143.89 | 143.9 | +43.9% |
| Q1 1996 | 145.46 | 145.5 | +45.5% |
| Q2 1996 | 147.31 | 147.3 | +47.3% |
| Q3 1996 | 148.21 | 148.2 | +48.2% |
| Q4 1996 | 150.76 | 150.8 | +50.8% |
| Q1 1997 | 153.07 | 153.1 | +53.1% |
| Q2 1997 | 155.33 | 155.3 | +55.3% |
| Q3 1997 | 157.08 | 157.1 | +57.1% |
| Q4 1997 | 159.48 | 159.5 | +59.5% |
| Q1 1998 | 162.54 | 162.5 | +62.5% |
| Q2 1998 | 165.69 | 165.7 | +65.7% |
| Q3 1998 | 169.25 | 169.3 | +69.2% |
| Q4 1998 | 174.39 | 174.4 | +74.4% |
| Q1 1999 | 179.13 | 179.1 | +79.1% |
| Q2 1999 | 185.60 | 185.6 | +85.6% |
| Q3 1999 | 192.35 | 192.3 | +92.3% |
| Q4 1999 | 197.21 | 197.2 | +97.2% |
| Q1 2000 | 203.42 | 203.4 | +103.4% |
| Q2 2000 | 209.44 | 209.4 | +109.4% |
| Q3 2000 | 217.65 | 217.6 | +117.6% |
| Q4 2000 | 224.43 | 224.4 | +124.4% |
| Q1 2001 | 231.20 | 231.2 | +131.2% |
| Q2 2001 | 234.81 | 234.8 | +134.8% |
| Q3 2001 | 236.34 | 236.3 | +136.3% |
| Q4 2001 | 237.82 | 237.8 | +137.8% |
| Q1 2002 | 240.97 | 241.0 | +141.0% |
| Q2 2002 | 242.62 | 242.6 | +142.6% |
| Q3 2002 | 243.71 | 243.7 | +143.7% |
| Q4 2002 | 246.64 | 246.6 | +146.6% |
| Q1 2003 | 246.33 | 246.3 | +146.3% |
| Q2 2003 | 245.94 | 245.9 | +145.9% |
| Q3 2003 | 247.38 | 247.4 | +147.4% |
| Q4 2003 | 248.55 | 248.6 | +148.6% |
| Q1 2004 | 251.18 | 251.2 | +151.2% |
| Q2 2004 | 255.27 | 255.3 | +155.3% |
| Q3 2004 | 256.33 | 256.3 | +156.3% |
| Q4 2004 | 255.77 | 255.8 | +155.8% |
| Q1 2005 | 262.88 | 262.9 | +162.9% |
| Q2 2005 | 261.42 | 261.4 | +161.4% |
| Q3 2005 | 264.46 | 264.5 | +164.5% |
| Q4 2005 | 268.93 | 268.9 | +168.9% |
| Q1 2006 | 269.33 | 269.3 | +169.3% |
| Q2 2006 | 267.43 | 267.4 | +167.4% |
| Q3 2006 | 267.65 | 267.6 | +167.6% |
| Q4 2006 | 268.17 | 268.2 | +168.2% |
| Q1 2007 | 266.74 | 266.7 | +166.7% |
| Q2 2007 | 265.96 | 266.0 | +166.0% |
| Q3 2007 | 263.98 | 264.0 | +164.0% |
| Q4 2007 | 259.45 | 259.4 | +159.4% |
| Q1 2008 | 253.16 | 253.2 | +153.2% |
| Q2 2008 | 253.71 | 253.7 | +153.7% |
| Q3 2008 | 249.93 | 249.9 | +149.9% |
| Q4 2008 | 247.06 | 247.1 | +147.1% |
| Q1 2009 | 251.37 | 251.4 | +151.4% |
| Q2 2009 | 255.50 | 255.5 | +155.5% |
| Q3 2009 | 259.73 | 259.7 | +159.7% |
| Q4 2009 | 259.44 | 259.4 | +159.4% |
| Q1 2010 | 261.86 | 261.9 | +161.9% |
| Q2 2010 | 257.29 | 257.3 | +157.3% |
| Q3 2010 | 251.77 | 251.8 | +151.8% |
| Q4 2010 | 258.31 | 258.3 | +158.3% |
| Q1 2011 | 251.31 | 251.3 | +151.3% |
| Q2 2011 | 247.18 | 247.2 | +147.2% |
| Q3 2011 | 255.48 | 255.5 | +155.5% |
| Q4 2011 | 252.73 | 252.7 | +152.7% |
| Q1 2012 | 257.50 | 257.5 | +157.5% |
| Q2 2012 | 266.31 | 266.3 | +166.3% |
| Q3 2012 | 273.30 | 273.3 | +173.3% |
| Q4 2012 | 280.67 | 280.7 | +180.7% |
| Q1 2013 | 284.29 | 284.3 | +184.3% |
| Q2 2013 | 294.80 | 294.8 | +194.8% |
| Q3 2013 | 301.92 | 301.9 | +201.9% |
| Q4 2013 | 308.46 | 308.5 | +208.5% |
| Q1 2014 | 314.09 | 314.1 | +214.1% |
| Q2 2014 | 320.66 | 320.7 | +220.7% |
| Q3 2014 | 326.91 | 326.9 | +226.9% |
| Q4 2014 | 340.81 | 340.8 | +240.8% |
| Q1 2015 | 354.82 | 354.8 | +254.8% |
| Q2 2015 | 362.21 | 362.2 | +262.2% |
| Q3 2015 | 374.39 | 374.4 | +274.4% |
| Q4 2015 | 381.75 | 381.8 | +281.8% |
| Q1 2016 | 392.05 | 392.1 | +292.1% |
| Q2 2016 | 403.21 | 403.2 | +303.2% |
| Q3 2016 | 414.32 | 414.3 | +314.3% |
| Q4 2016 | 424.22 | 424.2 | +324.2% |
| Q1 2017 | 432.84 | 432.8 | +332.8% |
| Q2 2017 | 443.85 | 443.9 | +343.9% |
| Q3 2017 | 452.22 | 452.2 | +352.2% |
| Q4 2017 | 464.44 | 464.4 | +364.4% |
| Q1 2018 | 479.30 | 479.3 | +379.3% |
| Q2 2018 | 484.43 | 484.4 | +384.4% |
| Q3 2018 | 490.67 | 490.7 | +390.7% |
| Q4 2018 | 494.22 | 494.2 | +394.2% |
| Q1 2019 | 495.94 | 495.9 | +395.9% |
| Q2 2019 | 503.77 | 503.8 | +403.8% |
| Q3 2019 | 510.76 | 510.8 | +410.8% |
| Q4 2019 | 519.94 | 519.9 | +419.9% |
| Q1 2020 | 526.81 | 526.8 | +426.8% |
| Q2 2020 | 527.82 | 527.8 | +427.8% |
| Q3 2020 | 553.58 | 553.6 | +453.6% |
| Q4 2020 | 575.82 | 575.8 | +475.8% |
| Q1 2021 | 598.29 | 598.3 | +498.3% |
| Q2 2021 | 630.37 | 630.4 | +530.4% |
| Q3 2021 | 657.08 | 657.1 | +557.1% |
| Q4 2021 | 676.12 | 676.1 | +576.1% |
| Q1 2022 | 723.30 | 723.3 | +623.3% |
| Q2 2022 | 733.95 | 734.0 | +634.0% |
| Q3 2022 | 702.86 | 702.9 | +602.9% |
| Q4 2022 | 698.83 | 698.8 | +598.8% |
| Q1 2023 | 694.18 | 694.2 | +594.2% |
| Q2 2023 | 705.80 | 705.8 | +605.8% |
| Q3 2023 | 721.01 | 721.0 | +621.0% |
| Q4 2023 | 721.67 | 721.7 | +621.7% |
| Q1 2024 | 718.76 | 718.8 | +618.8% |
| Q2 2024 | 721.13 | 721.1 | +621.1% |
| Q3 2024 | 720.70 | 720.7 | +620.7% |
| Q4 2024 | 733.28 | 733.3 | +633.3% |
| Q1 2025 | 732.29 | 732.3 | +632.3% |
| Q2 2025 | 715.30 | 715.3 | +615.3% |
| Q3 2025 | 722.18 | 722.2 | +622.2% |
| Q4 2025 | 710.82 | 710.8 | +610.8% |
| Q1 2026 | 708.60 | 708.6 | +608.6% |
| Q2 2026 | 708.28 | 708.3 | +608.3% |
Start with the year you bought your home
Here’s where I’d begin.
Open the page and find “When did you buy your home?” Choose your purchase year to see how the Denver Metro index has changed since the fourth quarter of that year. For example, choosing 2020 starts the comparison at the end of 2020, not your actual closing date. Purchases in 2026 are too recent for this feature.
Then try a different year.
The point isn’t to decide who bought at the “right” time. It’s to notice how much the starting point matters.
Think about someone who has owned a home for fifteen years and someone who purchased much more recently. The same market headline could raise very different questions for each of them.
For one, the question might be, “How does this recent change fit into the years I’ve owned?”
For the other, it might be, “What would this mean if I needed to move sooner than I expected?”
Both deserve more than a blanket statement that the market is up or down.
A purchase-year example
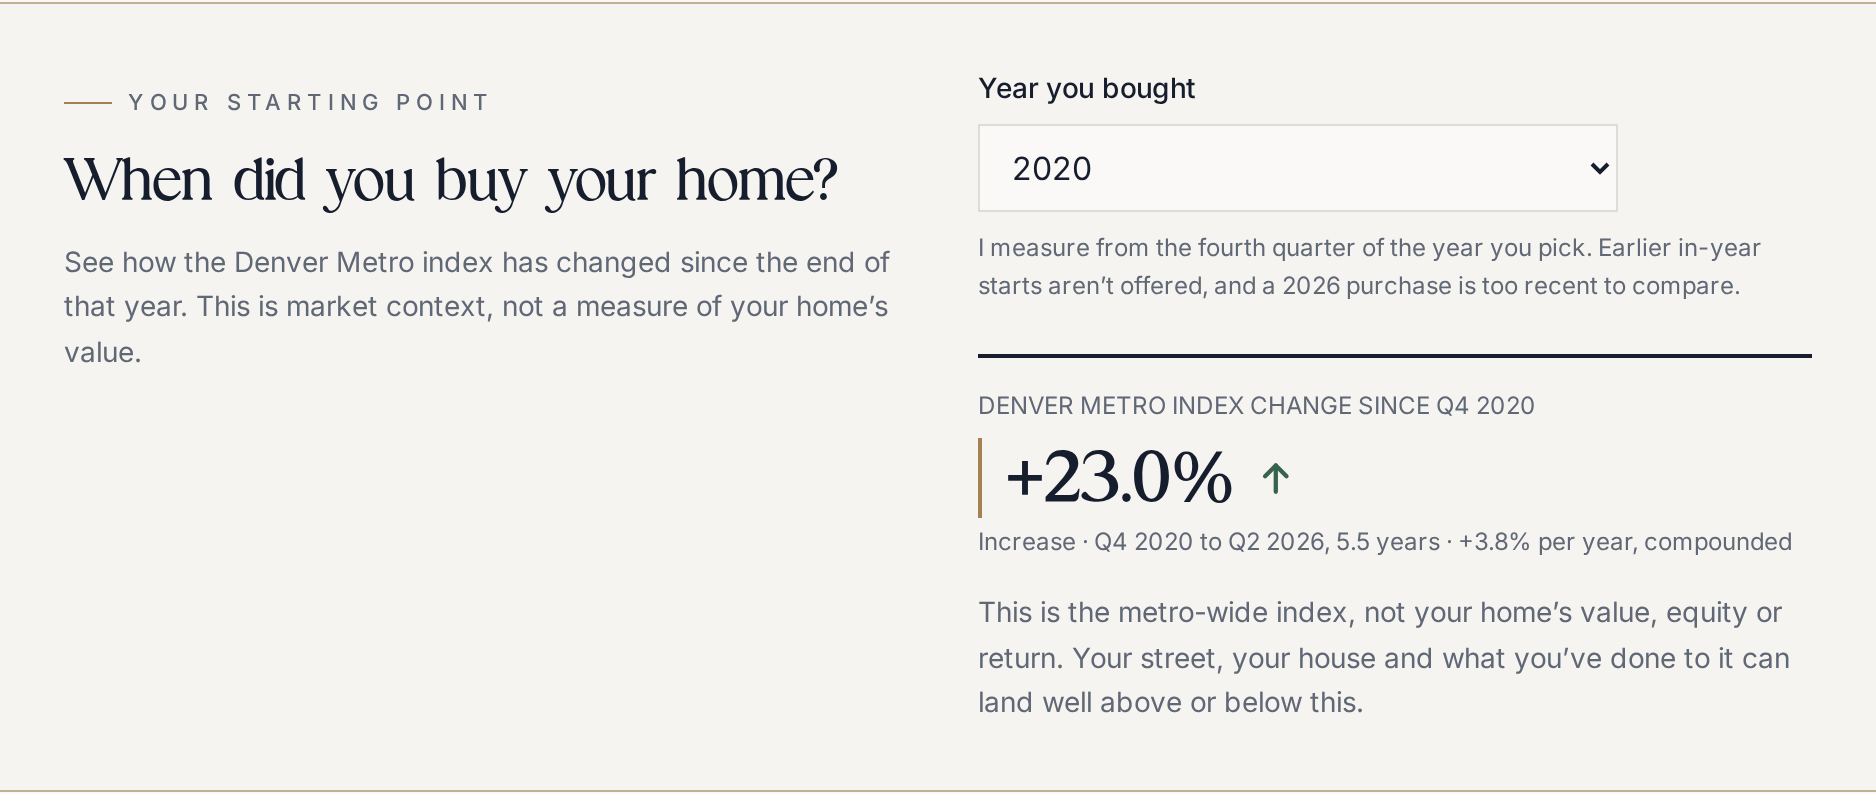
The actual purchase-year control is set to 2020. The comparison runs from Q4 2020 to Q2 2026, with total index change and compounded annual change calculated from the same verified seasonally adjusted FHFA vintage. Earlier in-year starts are not offered; 2026 purchases are too recent. This is not a home’s value, equity, profit or return. Historical context, not a forecast or appraisal; observations may be revised.
Underlying figures
| Measure | Verified example |
|---|---|
| Selected purchase year | 2020 |
| Starting quarter | Q4 2020 |
| Starting seasonally adjusted index | 575.82 |
| Ending quarter | Q2 2026 |
| Ending seasonally adjusted index | 708.28 |
| Metro index change | +23.0% |
| Elapsed years | 5.5 |
| Annual change, compounded | +3.8% per year |
A longer view should add context, not dismiss your concerns
I don’t believe a long-term chart should be used to wave away a short-term concern.
If you recently purchased a home and your circumstances have changed, being told to “look at the long run” may not answer the question you actually need help with.
The reverse is also worth considering. A negative headline about the past year does not, by itself, describe everything that has happened since you purchased.
The Granger takeaway
The useful question is not simply whether prices have changed. It’s what comparison is relevant to the decision in front of you.
I want this resource to help you make that distinction. Not to convince you to buy or sell, but to help you investigate before drawing a conclusion.
The market’s history is not your home’s value
This distinction matters.
The page uses the Federal Housing Finance Agency’s purchase-only House Price Index. That index tracks price changes using repeat sales of eligible single-family properties with mortgages acquired or securitized by Fannie Mae or Freddie Mac. It does not represent every transaction or every property type, and condominiums are excluded from this series.
In other words, I would not take the percentage on the chart, apply it to your purchase price, and call that your home’s value.
Understanding an individual property requires a closer look at its location, condition, size, features, and comparable sales in its market. Those property-specific comparisons are a different exercise from following a metro-wide index.
There’s another important distinction: price appreciation is not the same as profit. The index is not adjusted for inflation, and a price-change calculation does not subtract your mortgage interest, maintenance expenses, or transaction costs.
I’d use the chart as background for a conversation, not as a substitute for looking at your particular home and circumstances.
Take a look, then bring your questions
You don’t need to be planning a move to be curious about the housing market.
Perhaps you want to understand the years since you purchased. Perhaps you’re considering your first home and want more context. Or perhaps you simply enjoy learning about the place you live.
Start with a year that matters to you. Look at the surrounding years. Ask what the chart helps explain and what it leaves unanswered.
That’s the kind of work I want The Granger Report to do: make useful information easier to explore, explain its limits, and help you ask better questions.
Explore Denver Metro Home Appreciation
Curious about your own neighborhood? I’m happy to put together a complimentary Real Estate Review using recent nearby sales and homes currently for sale. You don’t have to be thinking about selling to start that conversation.
Sources and methodology
Sources checked October 13, 2026. The resource uses the FHFA purchase-only, seasonally adjusted Denver-Aurora-Centennial metro index, Q1 1991 through Q2 2026, downloaded October 11, 2026. Purchase-year comparisons start at Q4 of the selected year and end at Q2 2026; 2026 purchases are not supported. This metro index offers historical context, not a forecast, appraisal or individual return. FHFA may revise earlier observations. The HPI FAQs explain repeat-sales coverage, condominium exclusions and nominal prices; Fannie Mae describes property-specific comparable-sale factors.
The Granger Report is provided for educational and informational purposes only and is not legal, financial, or tax advice. Market data is deemed reliable but not guaranteed and should be verified before making real estate decisions. Market conditions can change.