
Westminster Market Report, February 2026
Can Westminster bridge the gap between Denver and Boulder buyers? Inventory is loosening, but the city continues to function as a stabilizer market.
The bottom line
Westminster is normalizing rather than slowing.
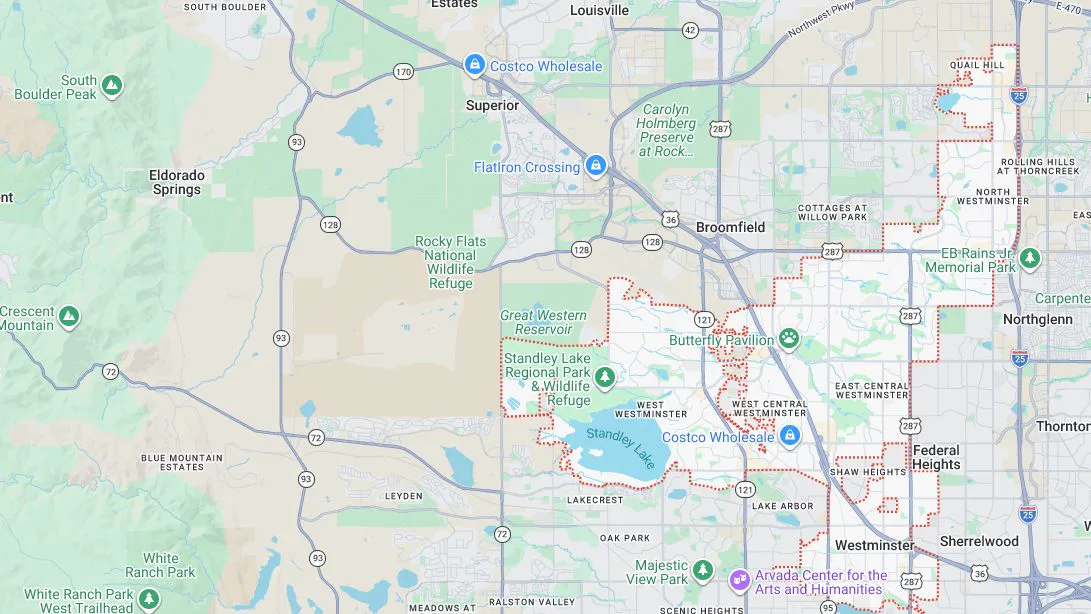
View report sections
The quick read
Can Westminster bridge the gap between Denver and Boulder buyers? Inventory is loosening, but the city continues to function as a stabilizer market.
What this means if you're buying
- Inventory is improving but strong homes still attract attention. Slower does not mean negotiable across the board — condition and location still separate outcomes.
- Compare carefully across Westminster, Broomfield, and Arvada. Westminster's value bridge between Denver and Boulder is most visible when you actually run those side-by-side.
- Match the neighborhood to the trade-off: Standley Lake for lifestyle and lots, Downtown Westminster / Westminster Station for transit and walkability, Legacy Ridge for newer construction and predictability.
What this means if you're selling
- Preparation is doing more work than pricing alone right now. Homes that show clearly and launch with context are still hitting strong sold-to-list ratios.
- Stop chasing last year's timeline expectations. With days on market at 41, the first two weeks set the tone for everything that follows.
- Position against your real competitive set, not your purchase price. Stable pricing combined with rising inventory means buyers are comparing more carefully than they were a year ago.
The Numbers Behind the Read
Supporting data for the signals above.
Median Sold Price
$570.75K
Sold-to-List Ratio
98.9%
Months of Inventory
1.51
Rising slightly
Median Days on Market
41
Market Type
Lean seller → balanced
Pricing Trend
Stable
Buyer Demand Indicator
Selective, deliberate
Seller Positioning Signal
Preparation > timing
Sold-to-list ratio
98.9%
At list
At a glance: Buyers are paying right around the asking price.
Days on market
Patient pace
41
median days
At a glance: Sitting longer than usual — pricing and prep matter more. About 9 days slower than the metro average.
Buyer / Seller Tilt
Seller leaning
Index
56
At a glance: Sellers have the edge — well-priced, well-prepped homes draw multiple looks.
Median Sold Price · 6 mo
Source: local MLS data as of February 25, 2026. Deemed reliable but not guaranteed. Educational use only — not an appraisal or valuation of any specific property.
Deeper ReadRead more
Westminster is normalizing rather than slowing. Inventory ticked up to 1.51 months — historically tight but loosening month over month.
Median sold price sits near $570,750, sold-to-list ratio is 98.9%, and median days on market has stretched to 41. Median values have drifted modestly downward year over year while monthly sold prices have edged up, which usually signals negotiation rather than decline.
Westminster continues to function as a value bridge between Denver and Boulder, where buyers and sellers meet in the middle.
Neighborhood context
Westminster has always functioned as connective tissue between Denver, Boulder, and the northern suburbs. Its identity is shaped less by a single historic core and more by layers of development — housing age spans new construction through homes more than 70 years old, with significant concentration in mid-century and 40 to 60 year stock. Greenbelts, lakes, and trail systems play an outsized role in how residents experience the city. The Downtown Westminster redevelopment continues to be the most meaningful long-term demand driver, with transit orientation, new multifamily and townhome product, and growing civic and restaurant investment shaping a different buyer profile than the established Standley Lake and Legacy Ridge corridors.
The map
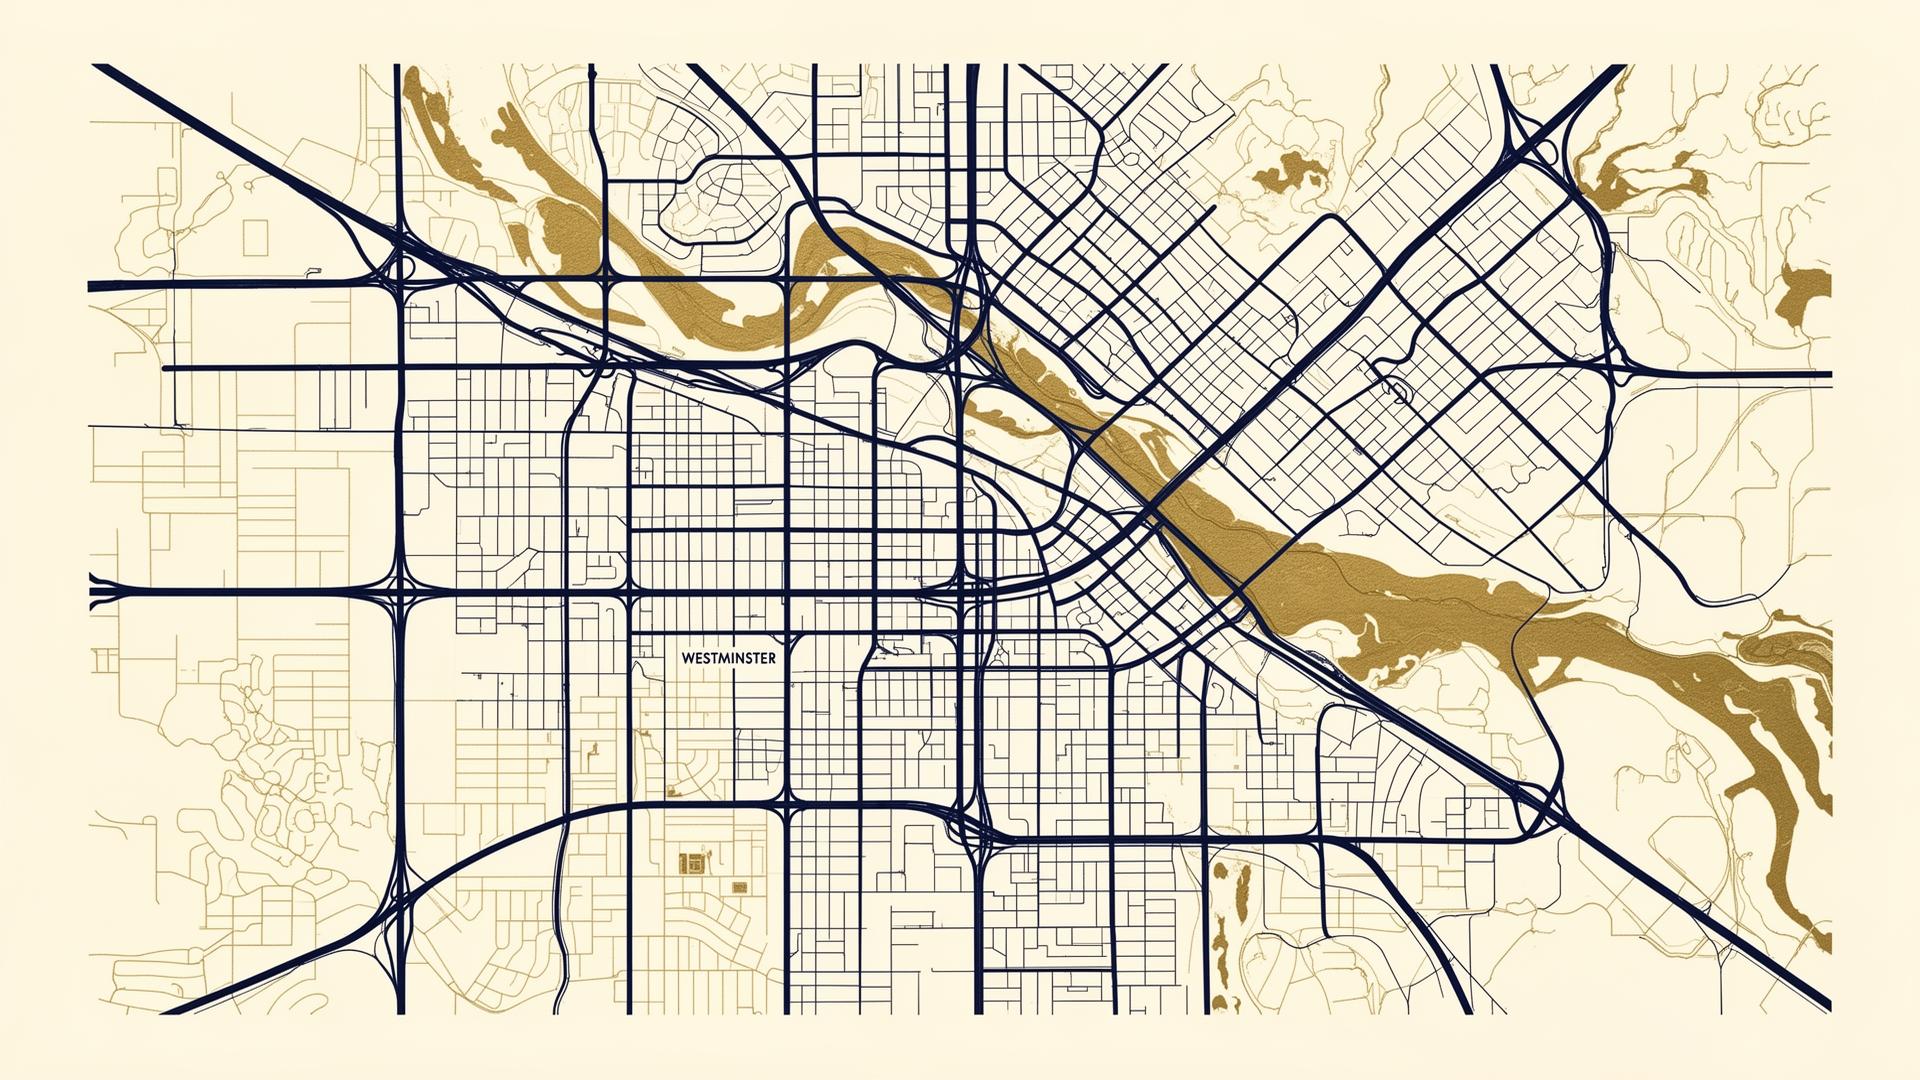
Stylized neighborhood map for orientation only.
Frequently asked
Where does Westminster fit between Denver and Boulder?
It is the value bridge. You get relative affordability compared to Boulder and Broomfield, with strong access, established neighborhoods, and meaningful ongoing reinvestment — especially in the Downtown Westminster / Westminster Station corridor.
Which Westminster neighborhood fits which buyer?
Standley Lake and West Westminster reward buyers prioritizing lifestyle, lots, and open space. Downtown Westminster and Westminster Station appeal to first-time buyers and downsizers who want walkability and transit. Legacy Ridge and North Westminster work for move-up buyers who want newer construction and long-term liquidity without Boulder pricing.
Is Westminster slowing down?
It is normalizing, not slowing. Inventory is improving, days on market are longer, and pricing is stable rather than rising — but the 98.9% sold-to-list ratio shows demand is intact when homes are positioned well.
Explore planning toolsOpen
Tools & Resources
Run the numbers, then keep reading.
Four calculators sized to Westminster's typical price band. Pick the question you're working through. All educational.
Payment snapshot
30-year fixed · Principal & interest
$2,886/mo
Loan amount
$456,600
Down cash
$114,150
Rate used
6.50%
Estimate excludes taxes, insurance, HOA, and closing costs. For planning only, not a loan offer.
Quick references
Glossary
Real estate terms, plain-English.
Sold-to-list, days on market, months of inventory — what they mean and why they move.
ReadBuyer checklist
Before your first tour.
What to have lined up — pre-approval, inspection priorities, the price band that matters.
ReadSeller checklist
Before you list.
Prep that consistently improves early activity — without overspending on renovations.
ReadNew construction
How builders structure incentives.
Rate buy-downs, design-center upgrades, and metro district disclosures to read first.
ReadCalculators are for planning only. Figures are estimates and not a loan, rental, valuation, or closing statement. Always confirm with a licensed lender or financial professional.
Tools & Resources
Run the numbers, then keep reading.
Four calculators sized to Westminster's typical price band. Pick the question you're working through. All educational.
Payment snapshot
30-year fixed · Principal & interest
$2,886/mo
Loan amount
$456,600
Down cash
$114,150
Rate used
6.50%
Estimate excludes taxes, insurance, HOA, and closing costs. For planning only, not a loan offer.
Quick references
Glossary
Real estate terms, plain-English.
Sold-to-list, days on market, months of inventory — what they mean and why they move.
ReadBuyer checklist
Before your first tour.
What to have lined up — pre-approval, inspection priorities, the price band that matters.
ReadSeller checklist
Before you list.
Prep that consistently improves early activity — without overspending on renovations.
ReadNew construction
How builders structure incentives.
Rate buy-downs, design-center upgrades, and metro district disclosures to read first.
ReadCalculators are for planning only. Figures are estimates and not a loan, rental, valuation, or closing statement. Always confirm with a licensed lender or financial professional.

About the author
Written by Jackson Granger.
Broker Associate · REALTOR® Coldwell Banker Realty · License FA.100105702. Jackson writes The Granger Report each week from his work across Denver Metro and the Front Range.
The Granger Report is provided for educational and informational purposes only and is not legal, financial, or tax advice. Market data is deemed reliable but not guaranteed and should be verified before making real estate decisions. Market conditions can change.
Keep reading