
Denver Metro
Denver’s October Market: Why the Type of Home Matters
Detached and attached homes are moving at different speeds. Here is how I would use the new numbers to make a more specific decision.
Jackson Granger · · 3 min read
Evidence dates
- Market observations:
- DMAR Market Trends Report, from through (released November 4, 2026; REcolorado data)
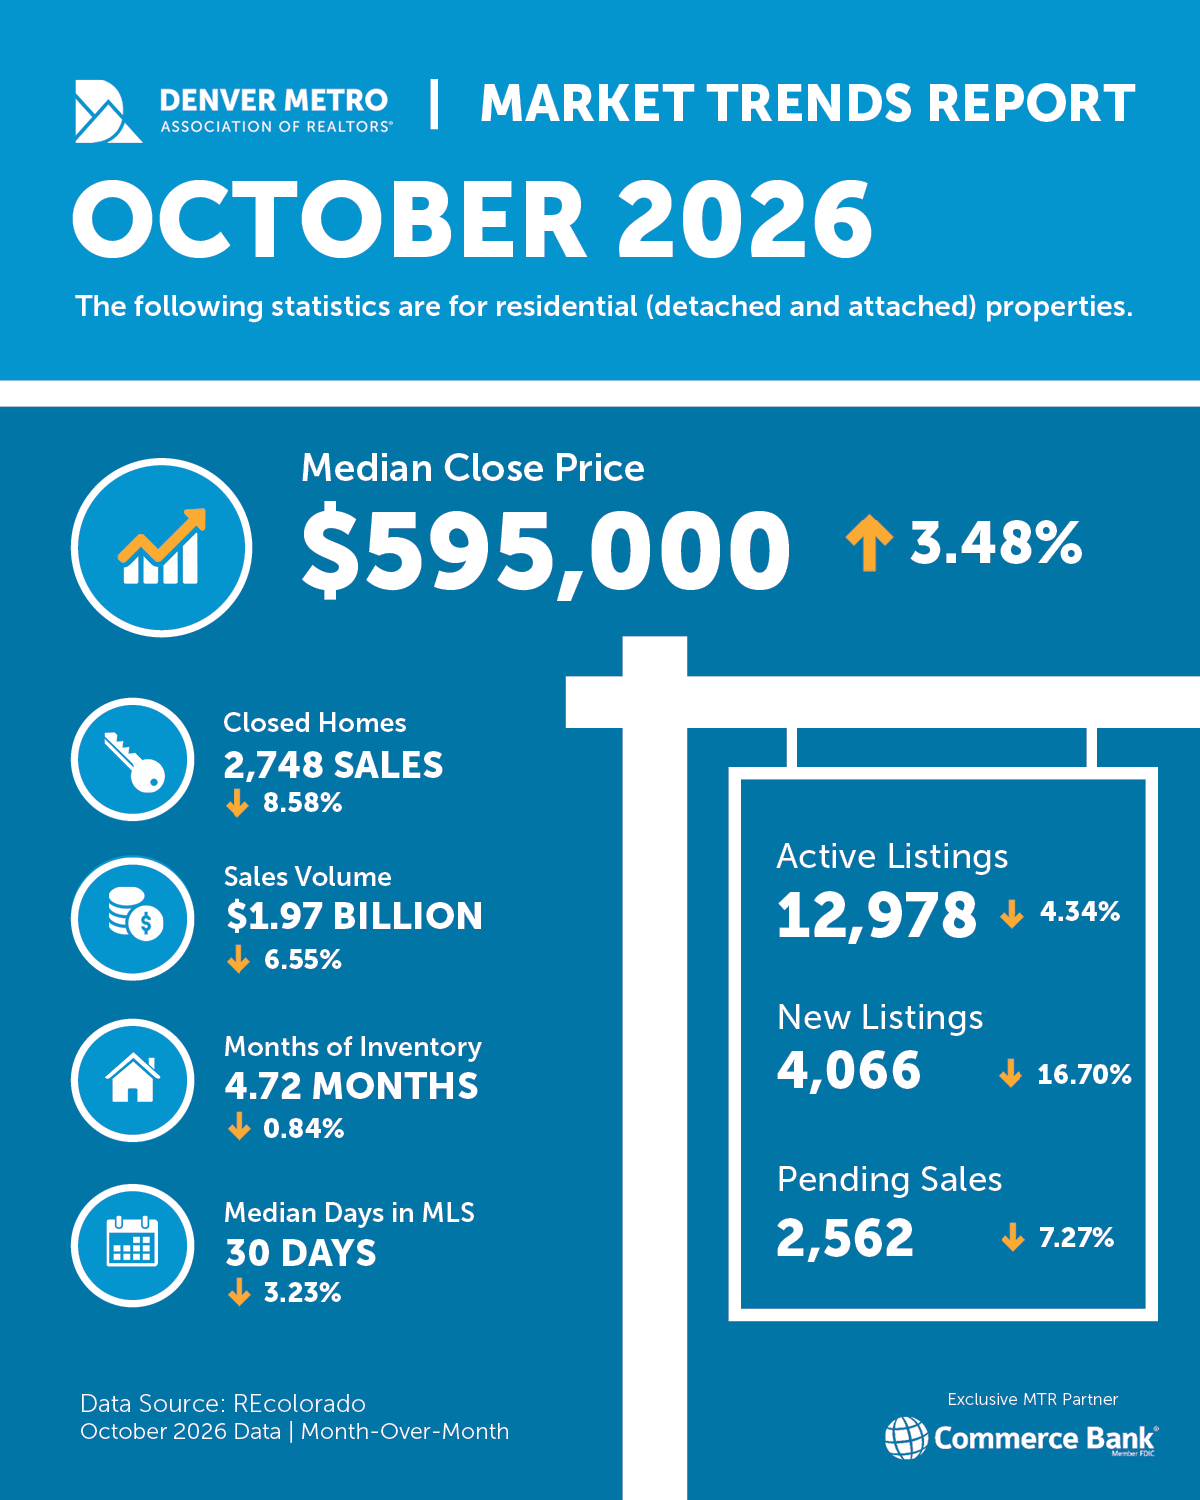
View the full-size infographic or DMAR’s infographic page.
You can read that Denver’s median sale price rose in October and still wonder why your own listing isn’t attracting an offer. A buyer can see almost 13,000 available homes and still struggle to find one that works.
The useful question is how much of that market actually competes with the home you own or want.
I start with property type. DMAR’s October release shows enough separation between detached and attached homes that a single regional headline leaves out part of the decision.
What changed in October
Across DMAR’s 11-county Denver metro area, the median close price was $595,000, up 3.48% from September. There were 2,748 closed sales, down 23.54% from October last year, and 12,978 active listings at month-end.
Those comparisons answer different questions: prices moved up from the previous month, while fewer homes sold than a year earlier. The infographic above uses month-over-month changes throughout.
For the full set of figures, I’ve updated the market stats page with the October release.
The difference that matters before you compare homes
The property-type breakdown gives that regional picture more definition:
Detached and attached homes, October 2026
DMAR October 2026 public summary, released November 4. Attached includes condos and townhomes; these are regional groups, not individual-home estimates.
October 2026 medians for detached and attached homes in DMAR’s 11-county Denver metro area. Detached homes: $645,000 median close price, 0.64% below October 2025, and a median of 26 days in the MLS. Attached homes: $375,000 median close price, 3.25% below October 2025, and a median of 48 days in the MLS.
| Measure | Detached homes | Attached homes |
|---|---|---|
| DMAR 11-county Denver metro | ||
| October median close price | $645,000 | $375,000 |
| Change from October 2025 | −0.64% | −3.25% |
| October median Days in MLS | 26 days | 48 days |
DMAR 11-county Denver metro
October median close price
- Detached homes
- $645,000
- Attached homes
- $375,000
Change from October 2025
- Detached homes
- −0.64%
- Attached homes
- −3.25%
October median Days in MLS
- Detached homes
- 26 days
- Attached homes
- 48 days
The attached median was further below last October’s level, and its median time in the MLS was 22 days longer than the detached figure. That is a meaningful difference when setting expectations for a sale or evaluating the alternatives to a purchase.
It does not mean every condo needs a discount or that every detached home will sell quickly. These are medians among the homes in the reported groups. An active listing can take much longer, and a change in the mix of homes sold can move the median price.
If you are buying an attached home
I would use the broader numbers as a reason to compare carefully. Start with similar homes in the same building or nearby developments, then look at the full monthly cost and the condition of the association.
What does the HOA fee cover? What do the budget, reserves and meeting minutes tell us? Is there a known assessment or an expense the buyer would need to plan for? A lower purchase price can look different once those details are on the table.
The October report gives us context for asking those questions. It does not tell us why any particular home has been sitting.
If you are preparing to sell
I would build the pricing conversation around the homes a buyer could choose instead of yours. For an attached property, that includes the association’s costs and condition as well as the unit itself. For a detached home, I would look closely at condition, location and the competing inventory in its price range.
Then I would watch which comparable homes reach an agreement and which continue to wait. That is more useful for a pricing decision than treating the metro median as a target.
If a home has been on the market for weeks, the question is what buyers encounter when they compare it with the alternatives.
The Granger takeaway
October’s numbers make the starting point clearer: identify the homes that actually compete with yours, then compare price, time and ownership costs within that group. That is where a regional market update becomes useful to your own decision.
Which part of the market are you trying to understand?
Send me the area, property type and price range you have in mind. I can help you work through the relevant comparisons.
Sources and reporting notes
Market observations cover October 2026 and come from DMAR’s public summary and infographic, released November 4, 2026, using REcolorado data for its 11-county Denver metro area. The infographic’s changes compare with September 2026. Property-type price changes in the table and the annual sales comparison are against October 2025. The 22-day gap is calculated as 48 minus 26. A median is not a home-value index or a forecast for an active listing. The market stats page retains earlier REcolorado Market Watch charts under their original source and dates; those observations are not joined to DMAR’s October figures as one continuous series.
- Denver Metro Association of REALTORS®, Market Trends Report, October 2026, public summary released November 4, 2026 (11-county Denver metro)
- Denver Metro Association of REALTORS®, Market Trends Overview infographic, October 2026, released November 4, 2026 (residential, detached and attached; month-over-month changes)
The Granger Report is provided for educational and informational purposes only and is not legal, financial, lending or tax advice. Market figures describe a reporting area as a whole and do not establish the value of any individual home. Confirm the details of your situation with your broker and, where relevant, your lender.