
Central Park Sells in a Week. So Why Are Prices Dipping?
Central Park homes are going under contract in only seven days, but the final sale price is starting to slip. Here is what I believe is happening in one of Denver's key neighborhoods.
The bottom line
On the ground in Central Park, I'm seeing a disconnect.
View report sections
The quick read
Central Park homes are going under contract in only seven days, but the final sale price is starting to slip. Here is what I believe is happening in one of Denver's key neighborhoods.
- Central Park Median Sold Price $910K
- Sellers Aim for Higher Listing Prices
- Negotiation Margin Narrows to 99.2%
A plain-English read on the key market signals.A plain-English read on the numbers behind this market.
Median Sold Price: $910K (Δ 20.37%) , Single Family
Central Park Median Sold Price $910K
$910K
Median sold price up, but this number reflects homes that closed last month, not current market value.
Local MLS, RPR
Median Active List Price
Sellers Aim for Higher Listing Prices
$872K
List prices reflect seller expectations, which are currently running higher than recent sold prices.
Local MLS, May 2026
Sold-to-List Ratio: 99.2% (Δ 0.8%) , Single Family
+99.2%Negotiation Margin Narrows to 99.2%
99.2%
Homes sold very close to asking price, reflecting strong current pricing power for sellers.
Local MLS,
What this means if you're buying
- The 99.2% sold-to-list ratio means you have more negotiating power than recent headlines might suggest.
- Check recent sales on Redfin, paying close attention to the original list price versus the final sale price.
- Note which homes have had price reductions, as this can signal a motivated seller and an opportunity for you.
What this means if you're selling
- Price your home correctly from the start, as nearly every buyer is successfully negotiating on price right now.
- With homes selling in a median of 11 days, your first weekend on the market is everything. Great photos are non-negotiable.
- A clean, well-maintained home gives buyers fewer reasons to negotiate, helping you close nearer to your asking price.
The Numbers Behind the Read
Supporting data for the signals above.
Median Sold Price
Rising20.4%$910K
Single Family
Median Active List Price
Rising8.0%$872K
Single Family
Sold-to-List Ratio
Rising0.8%99.2%
Single Family
Months of Inventory
Rising68.0%1.68
Single Family
Median Days on Market
Falling59.3%11
Single Family
Sold-to-list ratio
99.2%
At list
At a glance: Buyers are paying right around the asking price.
Days on market
Fast pace
11
median days
At a glance: Homes are going under contract quickly — competition is real. About 21 days faster than the metro average.
Buyer / Seller Tilt
Seller leaning
Index
60
At a glance: Sellers have the edge — well-priced, well-prepped homes draw multiple looks.
Source: local MLS data as of May 4, 2026. Deemed reliable but not guaranteed. Educational use only — not an appraisal or valuation of any specific property.
Deeper ReadRead more
On the ground in Central Park, I'm seeing a disconnect. Homes are selling at a fast clip, with a median of just seven days on the market.
But the final sale prices are telling a different story. Sellers are listing high, with the median list price for active homes at $895K.
Buyers, however, are pushing back. The median sold price has settled at $770K, a 1.1% dip.
That gap between the asking price and the closing price is the number I am watching most closely. Redfin may report a 100% list-to-sale ratio, but that's a market-wide average that can smooth over these details.
What I see is a 12% drop in new pending listings, which suggests some buyer hesitation. With only a one-month supply of homes, inventory is still incredibly tight.
This isn't a market correction, but it is a rebalancing. For a neighborhood used to consistent bidding wars, this change in dynamics is significant for both buyers and sellers.
Neighborhood context
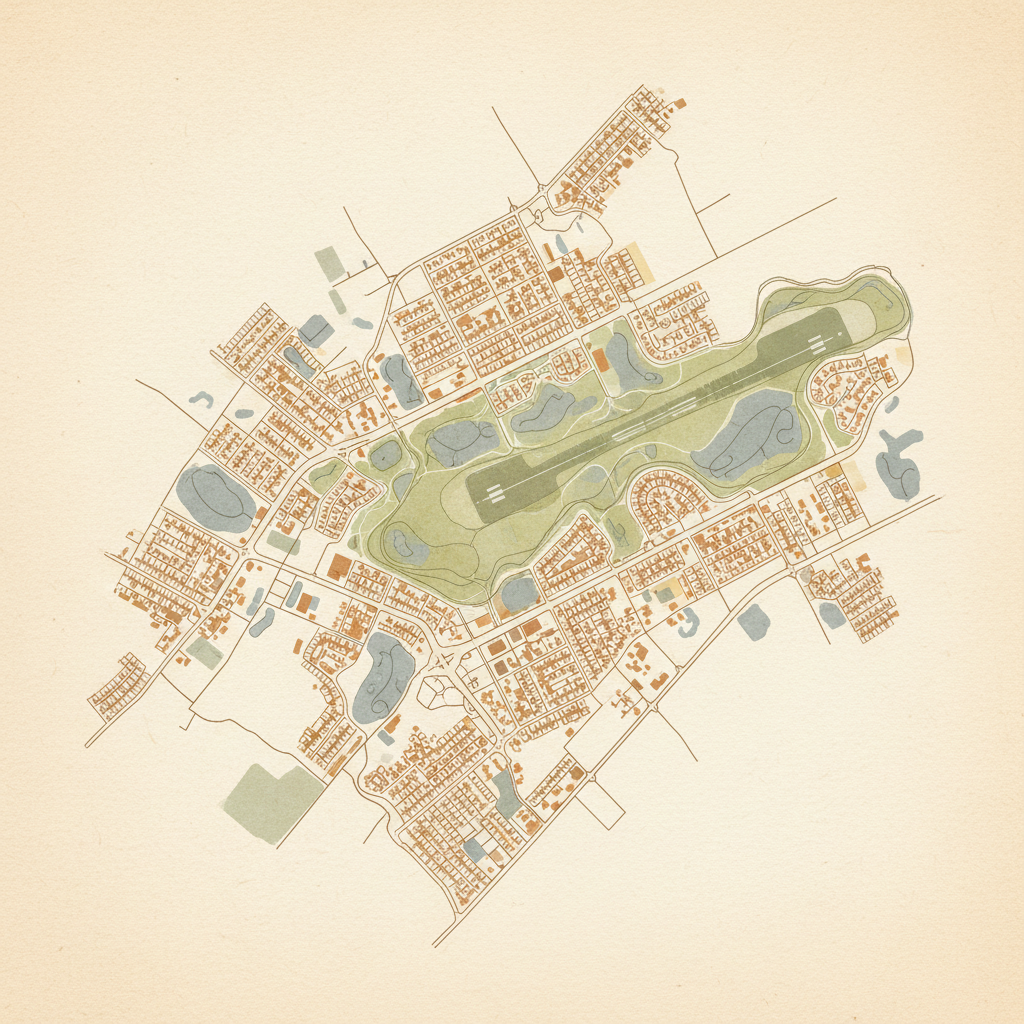
As a broker, Central Park is one of the neighborhoods I spend a lot of time in. Its parks, modern homes, and strong community feel mean it's always on the short list for my clients.
Frequently asked
I'm a buyer; what should I know about current prices in Central Park?
The median sold price for single-family homes in Central Park currently sits at $910K. While this is a significant increase year-over-year, it's worth noting that homes are generally selling about 2% below their initial list price, which suggests buyers have more room for negotiation than in previous months. For homes currently on the market, the median active list price is $872K.
How quickly are homes selling in Central Park right now?
Homes in Central Park are still selling very quickly. The median days on market is just 11 days, which is a considerable drop from the previous year. This indicates that while buyers have negotiation leverage, well-priced homes are still attracting offers quickly.
As a seller, how should I think about pricing my home in this market?
The current sold-to-list ratio in Central Park is 99.2%. This means most homes are selling very close to their asking price, but not above it. Pricing correctly from the outset is crucial, as buyers are successfully negotiating a bit on price. An aggressive initial price might deter buyers or lead to a longer time on the market, even though the overall market pace is fast.
Is it a good time to buy a single-family home in Central Park?
It's a more balanced market than it has been, offering buyers a bit more leverage. Homes are spending slightly longer on the market and selling just under list price, suggesting opportunities for negotiation. However, inventory remains relatively tight at 1.68 months, so desirable homes can still attract quick attention. Consulting with a local agent is always recommended to understand specific property conditions.
What is the median home sale price in Central Park right now?
The median sale price of a home in Central Park was $718K last month. That is up 7.1% from last year.[1]
How competitive is the Central Park housing market this month?
The Central Park housing market is very competitive. Homes sell after 35 days on average, with many getting multiple offers.[1]
Are homes selling above or below list price in Central Park?
Average homes in Central Park sell for about 1% below list price. Hot homes sell for around list price and go pending in 7 days.[1]
How many homes sold in Central Park recently?
There were 113 homes sold in Central Park in December 2025, down from 133 the year before. Zillow shows 1713 recent transactions overall.[1][4]
Is the price per square foot rising in Central Park?
The median sale price per square foot in Central Park is $308, up from last year. Another report lists it at $288, down 3.4%.[1]
How does Central Park compare to broader Denver trends?
While Denver home values dropped 2.2% from February 2025 to February 2026, Central Park median prices rose 7.1% year over year. The city saw increased price cuts on listings.[1][6]
Explore planning toolsOpen
Tools & Resources
Run the numbers, then keep reading.
Four calculators sized to Central Park's typical price band. Pick the question you're working through. All educational.
Payment snapshot
30-year fixed · Principal & interest
$4,601/mo
Loan amount
$728,000
Down cash
$182,000
Rate used
6.50%
Estimate excludes taxes, insurance, HOA, and closing costs. For planning only, not a loan offer.
Quick references
Glossary
Real estate terms, plain-English.
Sold-to-list, days on market, months of inventory — what they mean and why they move.
ReadBuyer checklist
Before your first tour.
What to have lined up — pre-approval, inspection priorities, the price band that matters.
ReadSeller checklist
Before you list.
Prep that consistently improves early activity — without overspending on renovations.
ReadNew construction
How builders structure incentives.
Rate buy-downs, design-center upgrades, and metro district disclosures to read first.
ReadCalculators are for planning only. Figures are estimates and not a loan, rental, valuation, or closing statement. Always confirm with a licensed lender or financial professional.
Tools & Resources
Run the numbers, then keep reading.
Four calculators sized to Central Park's typical price band. Pick the question you're working through. All educational.
Payment snapshot
30-year fixed · Principal & interest
$4,601/mo
Loan amount
$728,000
Down cash
$182,000
Rate used
6.50%
Estimate excludes taxes, insurance, HOA, and closing costs. For planning only, not a loan offer.
Quick references
Glossary
Real estate terms, plain-English.
Sold-to-list, days on market, months of inventory — what they mean and why they move.
ReadBuyer checklist
Before your first tour.
What to have lined up — pre-approval, inspection priorities, the price band that matters.
ReadSeller checklist
Before you list.
Prep that consistently improves early activity — without overspending on renovations.
ReadNew construction
How builders structure incentives.
Rate buy-downs, design-center upgrades, and metro district disclosures to read first.
ReadCalculators are for planning only. Figures are estimates and not a loan, rental, valuation, or closing statement. Always confirm with a licensed lender or financial professional.
We'll email the PDF and add you to the weekly read.

About the author
Written by Jackson Granger.
Broker Associate · REALTOR® Coldwell Banker Realty · License FA.100105702. Jackson writes The Granger Report each week from his work across Denver Metro and the Front Range.
The Granger Report is provided for educational and informational purposes only and is not legal, financial, or tax advice. Market data is deemed reliable but not guaranteed and should be verified before making real estate decisions. Market conditions can change.
Keep reading